
AfterDawn's 27th birthday
 Wow. Our site has reached the infamous "rock star age" of 27 years.
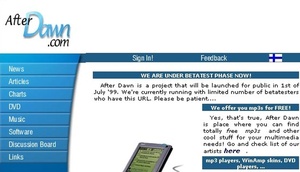
Yup, AfterDawn was officially launched on 10th of June, 1999 - back in the days when AltaVista was the leading search engine and Napster had just launched only couple of days before.
World has changed a lot since those days, but we are still here. Not as young and maybe not quite as cocky as we used to be - but very much alive.
As always, I'd like to thank all of you who have supported our site over all these years. Thank you, everybody!
-Petteri Pyyny, CEO
AfterDawn Oy
 Apple unveiled a
  At its summer 2026 WWDC event, Apple finally began its attempt to catch up after several years of lagging behind in the field of artificial intelligence, unveiling a range of new AI-powered technologies aimed at narrowing the gap with its competitors.